
Multimedia
Ice sheet mass balance from GRACE
February 7, 2012
In the first comprehensive satellite study of its kind, a University of Colorado Boulder-led team used NASA data to calculate how much Earth's melting land ice is adding to global sea level rise.
Using satellite measurements from the NASA/German Aerospace Center Gravity Recovery and Climate Experiment (GRACE), the researchers measured ice loss in all of Earth's land ice between 2003 and 2010, with particular emphasis on glaciers and ice caps outside of Greenland and Antarctica. The total global ice mass lost from Greenland, Antarctica and all Earth's glaciers and ice caps over the period studied was about 4.3 trillion tons (1,000 cubic miles), adding about 12 millimeters (0.5 inches) to global sea level. That's enough ice to cover the United States 1.5 feet (0.5 meters) deep.
About a quarter of the average annual ice loss came from glaciers and ice caps outside of Greenland and Antarctica (about 148 billion tons, or 39 cubic miles), while ice loss from Greenland and Antarctica and their peripheral ice caps and glaciers averaged roughly 385 billion tons (100 cubic miles) a year. Results of the study are published online Feb. 8 in the journal Nature.
"Earth is losing a huge amount of ice to the ocean annually, and these new results will help us answer important questions in terms of both sea rise and how the planet's cold regions are responding to global change," said University of Colorado Boulder physics professor John Wahr, who helped lead the study.
"The strength of GRACE is it sees all the mass in the system, even though its resolution isn't high enough to allow us to determine separate contributions from each individual glacier," said Wahr, also a fellow at the University of Colorado-headquartered Cooperative Institute for Research in Environmental Sciences. Traditional estimates of Earth's ice caps and glaciers have been made using ground measurements from relatively few glaciers to infer what all the world's unmonitored glaciers were doing. Only a few hundred of the roughly 200,000 glaciers worldwide have been monitored for longer than a decade.
One unexpected study result from GRACE was that the estimated ice loss from high Asian mountain ranges like the Himalaya, the Pamir and the Tien Shan was only about 4 billion tons of ice annually. Some previous ground-based estimates of ice loss in these high Asian mountains have ranged up to 50 billion tons annually, Wahr said.
"The GRACE results in this region really were a surprise," said Wahr. "One possible explanation is that previous estimates were based on measurements taken primarily from some of the lower, more accessible glaciers in Asia and were extrapolated to infer the behavior of higher glaciers. But unlike the lower glaciers, most of the high glaciers are located in very cold environments, and require greater amounts of atmospheric warming before local temperatures rise enough to cause significant melting. This makes it difficult to use low-elevation, ground-based measurements to estimate results from the entire system."
"This study finds that the world's small glaciers and ice caps in places like Alaska, South America and the Himalayas contribute about 0.4 millimeters (.02 inches) per year to sea level rise," said Tom Wagner, cryosphere program scientist at NASA Headquarters in Washington. "While this is lower than previous estimates, it confirms that ice is being lost from around the globe, with just a few areas in precarious balance. The results sharpen our view of land ice melting, which poses the biggest, most threatening factor in future sea level rise."
Launched in 2002, the twin GRACE satellites track changes in Earth's gravity field by noting minute changes in gravitational pull caused by regional variations in Earth's mass, which for periods of months to years is typically due to movements of water on Earth's surface. It does this by measuring changes in the distance between its two identical spacecraft to one-hundredth the width of a human hair. The spacecraft, developed by NASA's Jet Propulsion Laboratory, Pasadena, Calif., are in the same orbit approximately 220 kilometers (137 miles) apart.
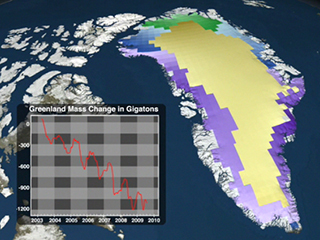
This animation shows the average yearly change in mass, in cm of water, during 2003-2010, over Greenland and Antarctica. Regions with large ice loss rates are denoted with the blue and purple colors. There are enormous ice loss rates over substantial regions of both ice sheets. A colorbar shows the range of values displayed.
