Multimedia
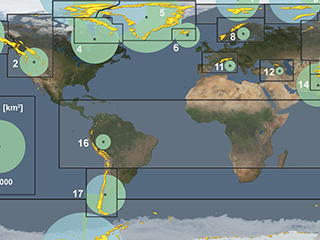
Regional rates of glacier loss for 2003 to 2009

May 16, 2013
In this image, global glacial mass loss and area are summarized by regions. The area of the red circles corresponds to the annual glacial mass loss from 2003 to 2009. Glacier mass change estimates are determined from a combination of satellite altimetry (ICESat), satellite gravimetry (GRACE) and in situ field observations as determined by Gardner et al. Light orange halos surrounding red circles show the 95 percent confidence interval in mass change estimates, but can only be seen in regions with large uncertainties.
The area of the green/blue circles depicts total glacier area for each region with the tidewater basin fractions [TW] shown separately in blue. The geographic locations of all glaciers, evident primarily in mountainous regions and high latitudes, are shown in yellow with their area increased to improve visibility.
