
Regional Relative Sea-Level Change
Although changes in global mean sea level (GMSL) provide an important measure of the warming climate, when assessing potential impacts at the coast, it is the change in regional relative sea level that is most important. Regional relative sea-level change is influenced by multiple physical processes that vary both in space and time and can lead to large regional departures from the long-term rate of global mean sea-level rise. For each process, a brief description is provided, in addition to a summary of the observing systems used to measure that process, and a future outlook for the understanding of that process. While there are different ways to separate and group the contributing processes, we define regional relative sea-level change as follows, with each process changing in both space and time:
Regional Relative Sea Level = Short-Term Effects + Sterodynamic Variability + Glaciers + Land Water Storage + Ice Sheets + Subsidence
Short-term Effects: Variations of sea level on periods ranging from minutes to weeks that arise from processes like storm surge, wave runup, wave setup, astronomical tides and freshwater input.
Sterodynamic Variability: Sea level change that arises from variability in the ocean’s circulation, temperature and saltiness. This includes large-scale climate signals like the seasonal cycle, El Niño-Southern Oscillation, North Atlantic Oscillation, and Pacific Decadal Oscillation. This also includes longer-term changes in ocean circulation that may occur in the future and global sea level rise associated with long-term warming of the ocean and associated expansion.
Glaciers: Glaciers outside of the ice sheets account for about 1% of total ice trapped on land. These changes are expressed regionally through gravitational, rotational and deformational (GRD) changes that have a characteristic pattern, or fingerprint.
Land Water Storage: Changes associated with the transfer of water between land and ocean. This includes variability in the global water cycle, groundwater withdrawal, and water impoundment. These changes are expressed regionally through gravitational, rotational and deformational (GRD) changes that have a characteristic pattern, or fingerprint.
Ice Sheets: The Greenland and Antarctic ice sheets contribute to global sea level rise, and these changes are expressed regionally through gravitational, rotational and deformational (GRD) changes that have a characteristic pattern, or fingerprint.
Subsidence: Movement of the land at the coast (could also be uplift) in response to a range of physical processes including groundwater and hydrocarbon withdrawal, tectonics, and glacial isostatic adjustment. These changes can vary widely in both time and space and can be associated with human activities.
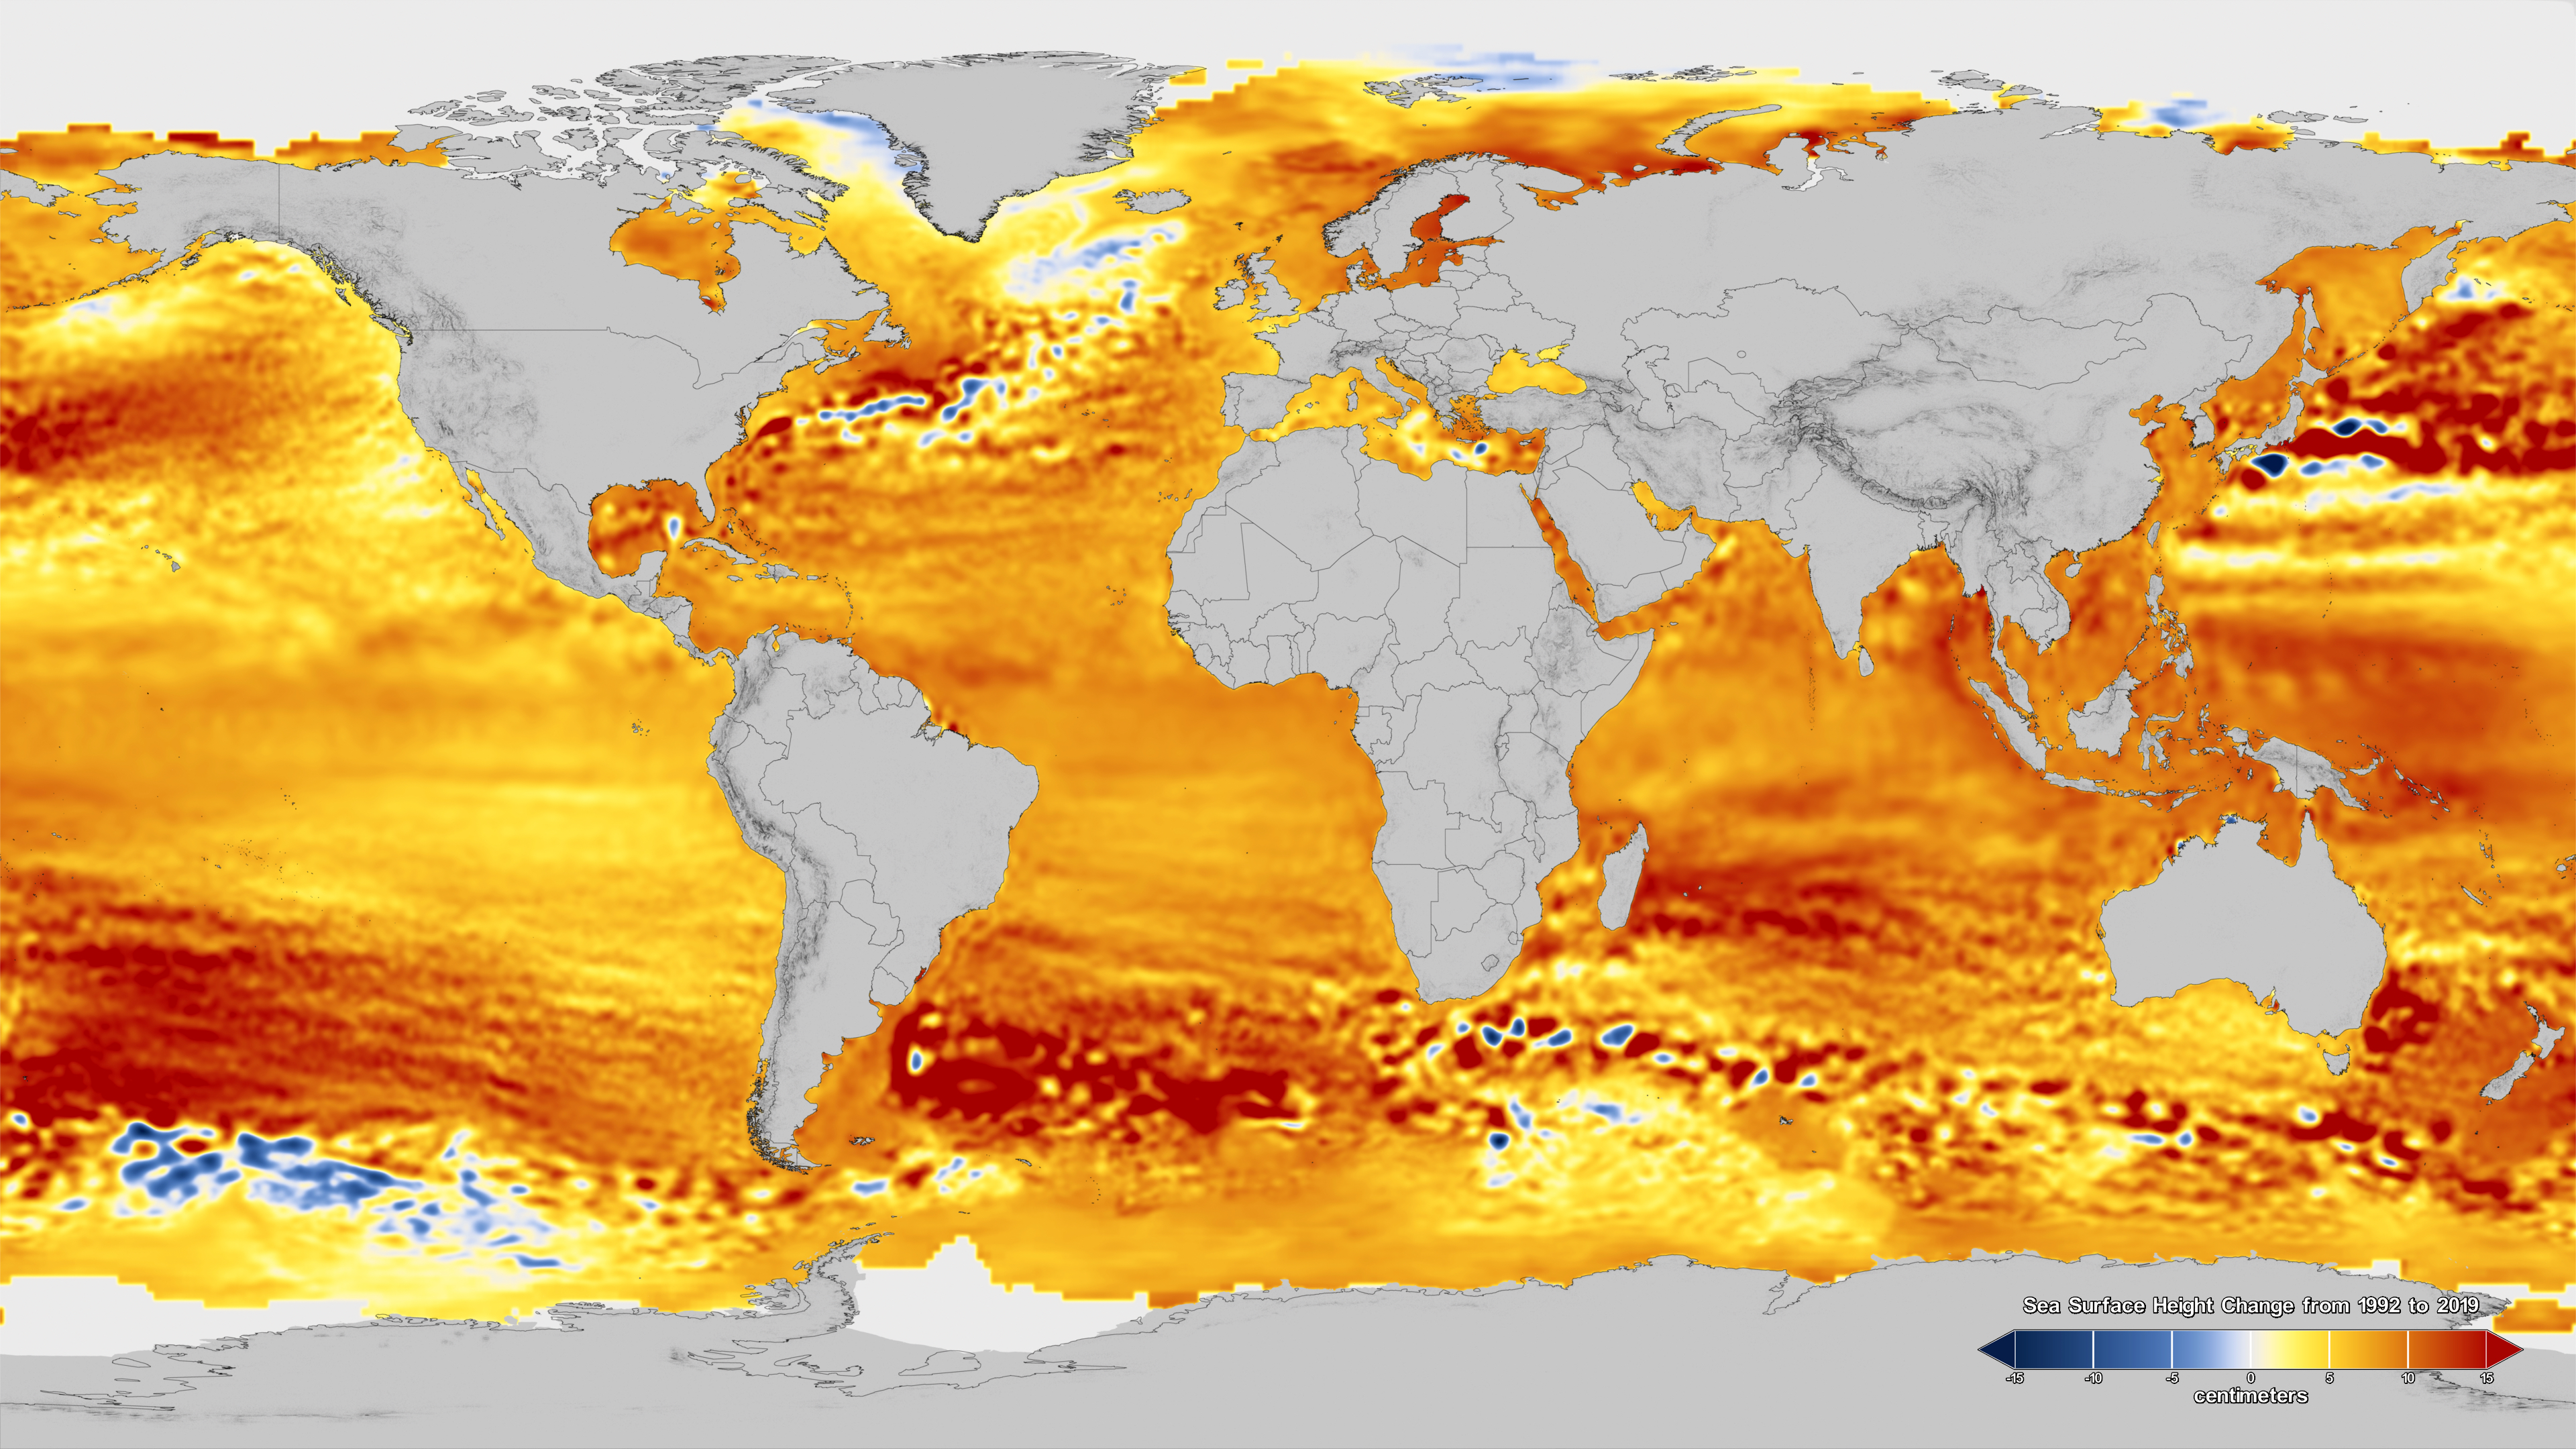 Regional sea-level change between 1992 and 2019, based on data collected from the TOPEX/Poseidon, Jason-1, Jason-2, and Jason-3 satellite altimeters. Blue regions are where sea level has gone down, and orange/red regions are where sea level has gone up. Since 1993, seas around the world have risen an average rate of 3.3 millimeters per year. Credit: NASA
