
Understanding Sea Level
Vital Signs
Global Mean Sea Level
What is global mean sea level?
This is the average height of the entire ocean surface. Global mean sea level rise is caused primarily by two factors related to global warming: the added water from melting land-based ice sheets and glaciers and the expansion of seawater as it warms.
What are we looking at?
The plot shows global change in sea level since 1993, as observed by satellite altimeters. The black line tracks the measurements, while the blue line shows how much uncertainty is associated with these measurements.
Note: The data shown in the plot does not include the glacial isostatic adjustment (GIA).
Why do we care?
Global mean sea level is an important climate indicator, providing information on how the ocean is warming and how much land ice is melting. Global sea levels have been rising for decades in response to a warming climate. The annual rate of rise – or how quickly sea level rise is happening – has also increased from 0.08 inches/year (0.20 centimeters/year) in 1993 to the current yearly rate of 0.17 inches/year (0.44 centimeters/year). Data on this increase in the rate of global sea level rise is critical to planners understanding the trajectory of future sea level rise. More information on the importance of the 30-year satellite record and data on the trajectory of global mean sea level can be found here.
Reference: Willis, Hamlington, Fournier, 2023.
Reference: Beckley et al., 2017; GMSL dataset
Missions
Satellite Altimetry (TOPEX/Poseidon and Jason I, II, III, Sentinel-6 Michael Freilich)
SATELLITE DATA: 1993 - PRESENT
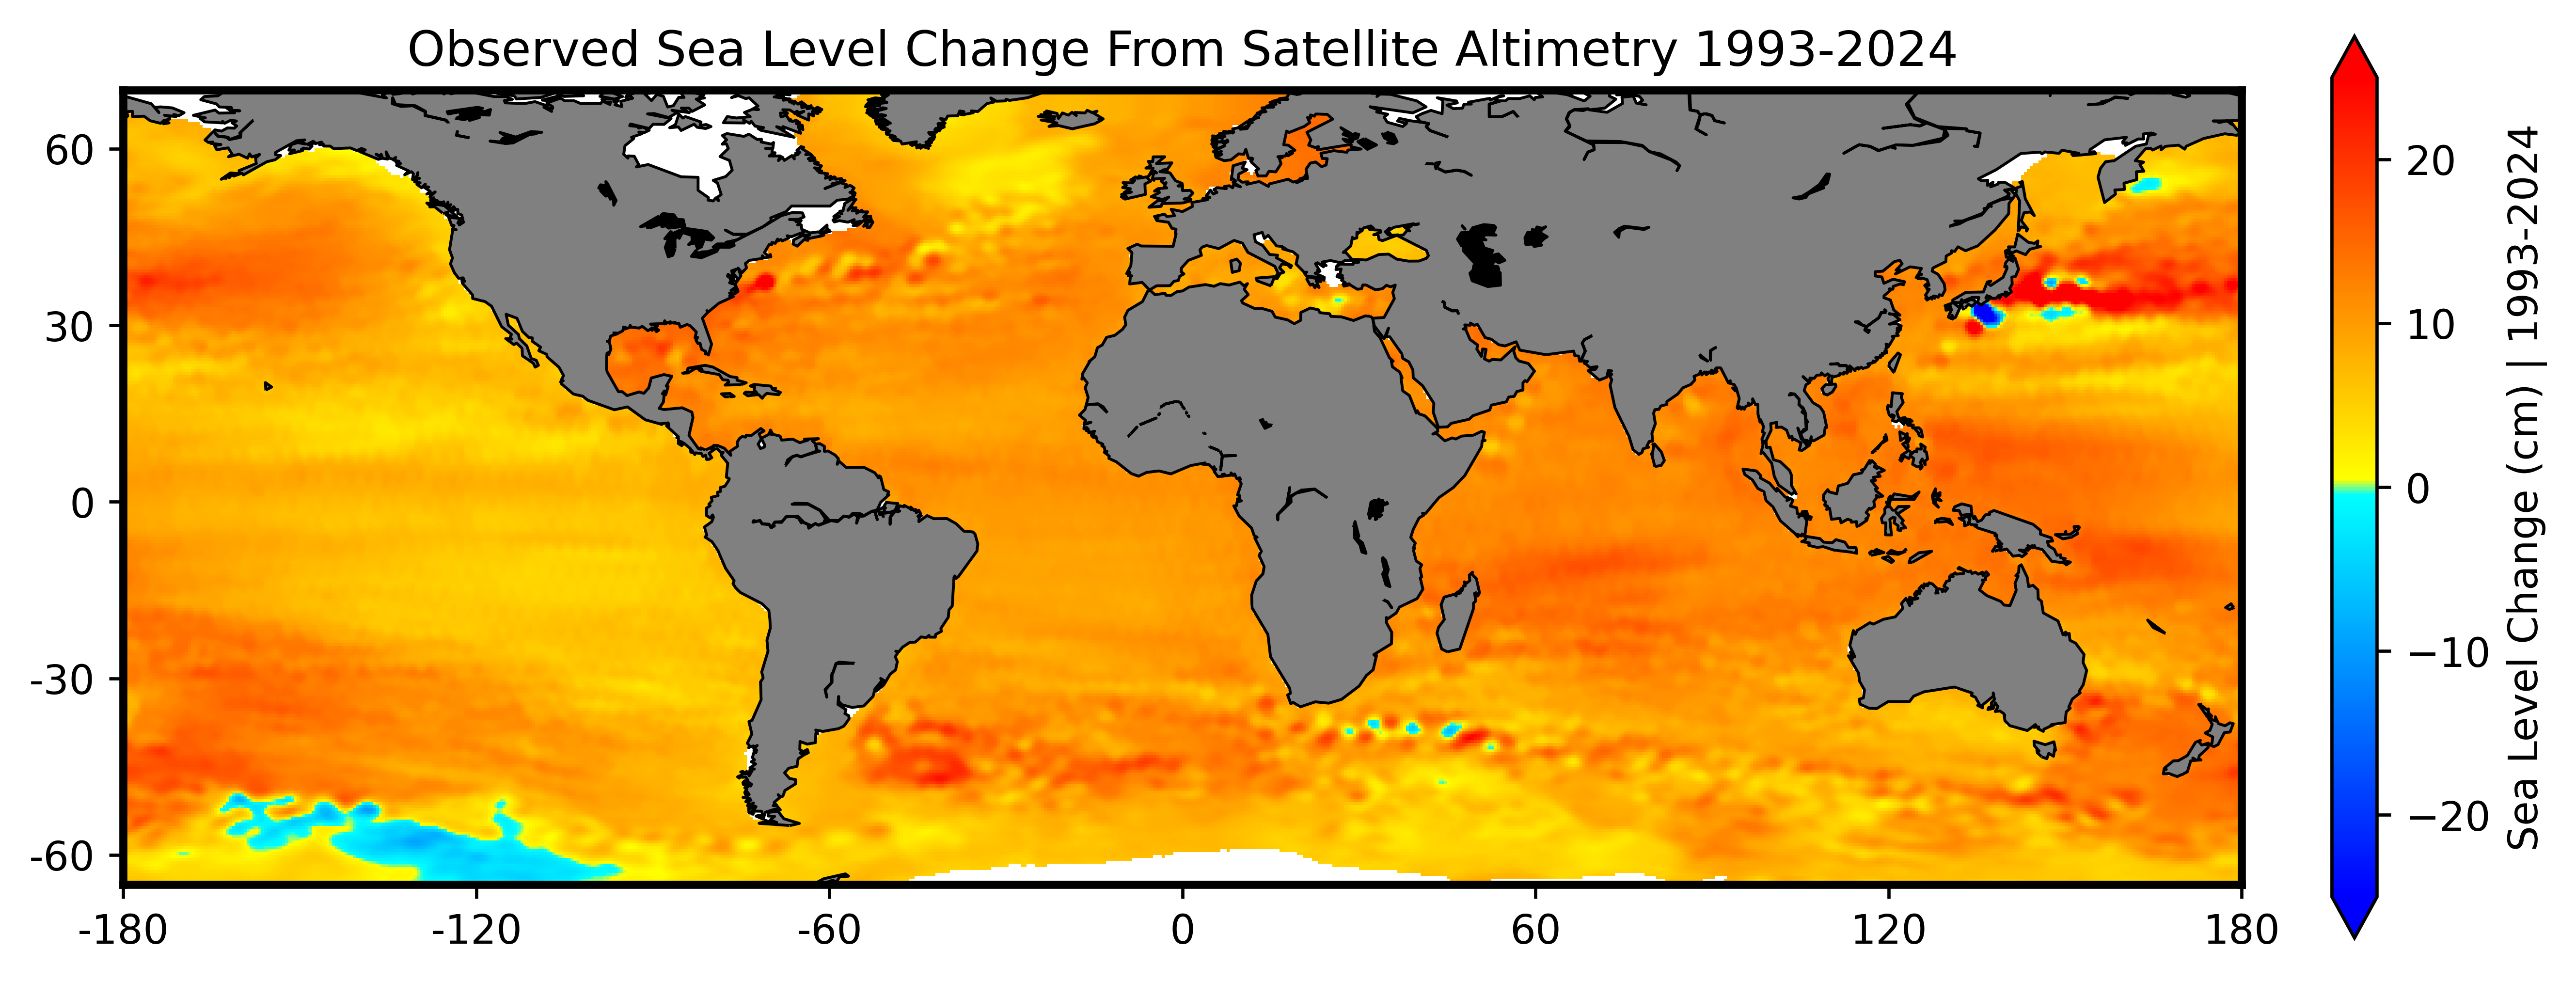 For over 31 years, satellite altimeters have measured the sea surface height of our ever-changing oceans. This image shows the change in sea surface height across the globe from 1993 to 2024. Credit: NASA
