Multimedia
Video: Greenland Ice Mass Loss 2002-2020
March 25, 2021
The Greenland ice sheet's mass has rapidly declined in the last several years due to surface melting and iceberg calving. Research based on satellite data indicates that between 2002 and 2020, Greenland shed 279 billion metric tons of ice per year, adding to global sea level rise.
These images, created from GRACE and GRACE-FO data, show changes in Greenland ice mass since 2002. Orange and red shades indicate areas that lost ice mass, while light blue shades indicate areas that gained ice mass. White indicates areas where there has been very little or no change in ice mass since 2002.
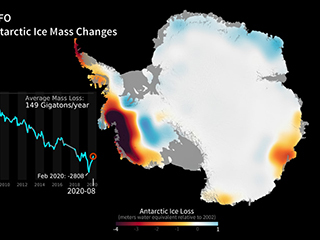
In general, higher-elevation areas near the center of Greenland experienced little to no change, while lower-elevation and coastal areas experienced over 16.4 feet (5 meters) of ice mass loss (expressed in equivalent-water-height; dark red) over this 19-year period. The largest mass decreases occurred along the West Greenland coast.
The average flow lines (gray; created from satellite radar interferometry) of Greenland’s ice converge into the locations of prominent outlet glaciers and coincide with areas of highest mass loss. This supports other observations that warming ocean waters around Greenland play a key role in contemporary ice mass loss.
View and download a similar visualization of Antarctica: https://sealevel.nasa.gov/resources/120/video-antarctic-ice-mass-loss-2002-2020/.
Credit
NASA and JPL/Caltech
