Multimedia
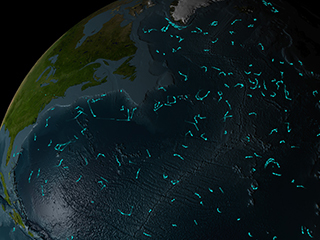
ARGO float animation #2
July 29, 2005
This visualization shows the locations of the ARGO buoy array over time. When the buoys above water, the lines are brighter; when the buoys are under water, the lines are fainter. The ARGO buoys measure ocean salinity, column temperature, and current velocities. This version of the visualization uses a faster camera move than version #1.
Watch this visualization with a slower camera move here.
