Multimedia
Video: 27-Year Sea Level Rise
March 2, 2021
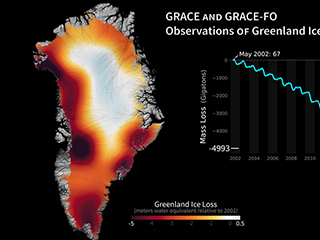
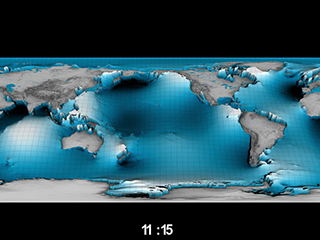
This visualization shows total sea level change between 1992 and 2019, based on data collected from the TOPEX/Poseidon, Jason-1, Jason-2, and Jason-3 satellites. Blue regions are where sea level has gone down, and orange/red regions are where sea level has gone up.
Since 1993, seas around the world have rising at an average rate of 3.3 millimeters per year, which is like adding 2.5x the water in Lake Erie to the ocean every year, or about 25x that amount per decade.
The color range for this visualization is -15 cm to +15 cm (-5.9 inches to +5.9 inches), though measured data extend above and below 15 cm (5.9 inches). This particular range was chosen to highlight variations in sea level change.
Credit
NASA's Scientific Visualization Studio
