
Multimedia
Regional assessments of glacier mass
November 29, 2013
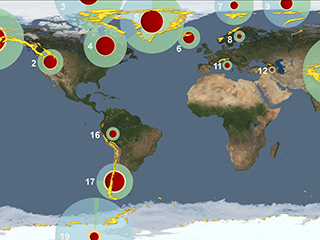
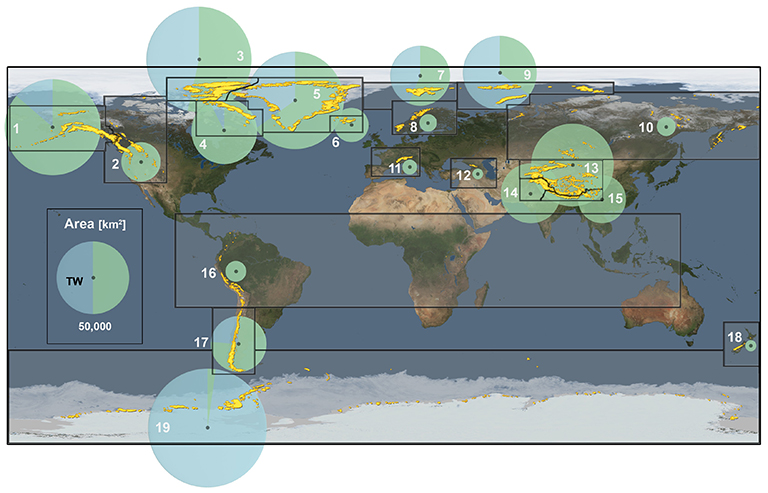
Global distribution of glaciers (yellow) and area covered (size of the circle), sub-divided into the 19 RGI regions (white number) referenced in Table 4.2 of the IPCC report. The area portion covered by tidewater terminating (TW) glaciers in each region is shown in blue.
In this image, which serves as Figure 4-8 in the Fifth Assessment Report of the Intergovernmental Panel on Climate Change (IPCC), the size of the green circles depicts total area covered by glaciers in each region with the tidewater basin fractions [TW] shown separately in blue. The Randolph Glacier Inventory (RGI) regions, designated by the white number, are referenced in Table 4.2 in the IPCC report. The geographic locations of all glaciers, evident primarily in mountainous regions and high latitudes, are shown in yellow with their area increased to improve visibility. Glacier locations and areas were obtained from airborne and Landsat ETM+, ASTER or SPOT5 satellite imagery and are from the Randolph Glacier Inventory Version 2.0 (Arendt et al., 2012).
For additional information, refer to the paper available here.
