NASA
Sea Level Change
Skip Navigation
menu close modal
  • News & Features
    • Sea Level News
    • Scientist Interviews
    • News Briefs
  • Understanding Sea Level
    • Overview
    • Global Sea Level
    • Regional Sea Level
    • By the Numbers
    • Vital Signs
  • Science Team
    • Overview
    • Team Members
  • Assessment Tools
    • Pacific Islands Flooding Analysis Tool
    • IPCC AR6 Sea Level Projection Tool
    • Flooding Analysis Tool
    • Interagency Sea Level Rise Scenario Tool
    • Sea Level Evaluation & Assessment Tool
    • All Assessment Tools
  • Analysis Tools
    • Data Analysis Tool
    • Virtual Earth System Laboratory
    • All Analysis Tools
  • Partners
  • Resources
    • Multimedia
    • Publications
    • Glossary
    • FAQ
    • Missions
Stay Connected
Previous Article
Sea surface height anomaly
Next Article
Monthly changes in gravity affect sea level

Multimedia

Measuring Greenland's ice (poster)

Greenland's melting ice (poster)

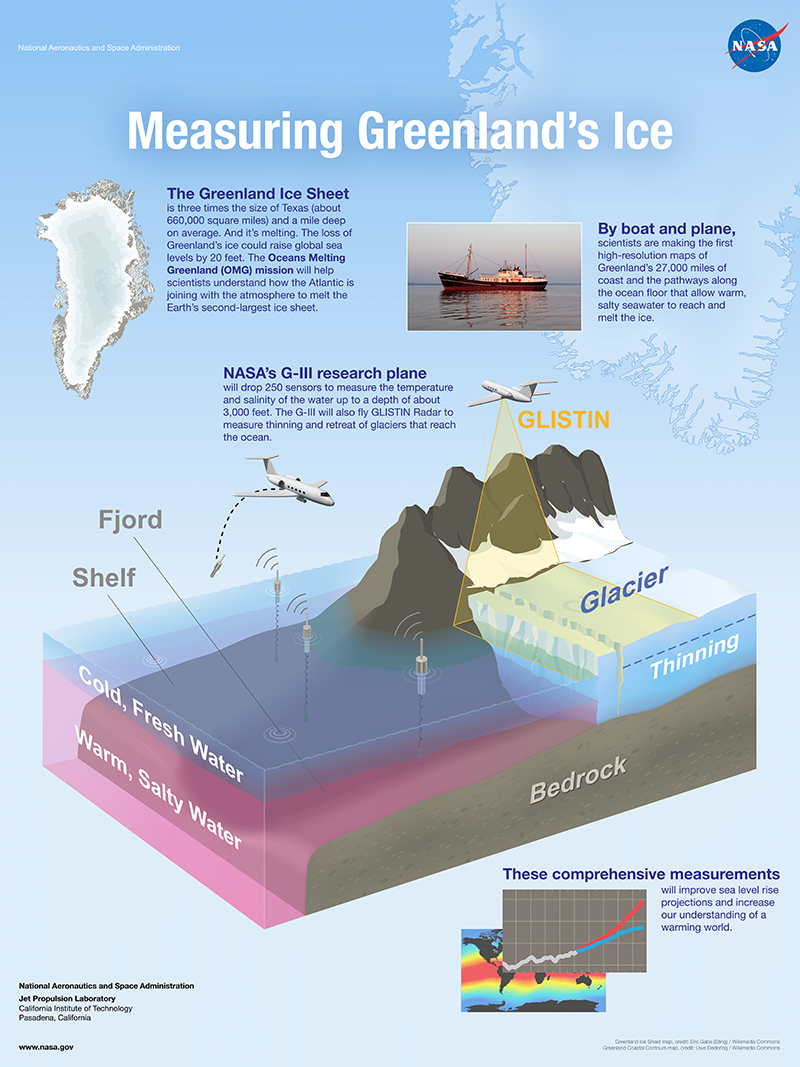
A poster titled 'Measuring Greenland's Ice' depicting the various measurement mechanisms that will be utilized by the Oceans Melting Greenland (OMG) mission.

Credit

Oceans Melting Greenland

ENLARGE

Downloads

OMG poster 6000x8000 png (15.3 MB)

Related Resources

Animation of how ice is naturally transported from interior topographic divides to the coast via glaciers.

More
Greenland ice flow
Greenland ice flow

Visualization of the locations of the ARGO buoy array over time (with faster camera move).

More
ARGO float animation #2

Global sea level rise is accelerating incrementally over time rather than increasing at a steady rate, as previously thought.

More
Sea level rise accelerates over time
Video: Sea level rise accelerates over time

We know seas are rising and we know why. The urgent questions are by how much and how quickly. 

More
Infographic: Sea level rise

Whiteboard animation explaining Greenland's melting ice sheet as climate change's canary in a coal mine.

More
NASA's Earth Minute: Greenland ice
Video: NASA's Earth Minute - Greenland ice

TOPEX-Poseidon altimeter sea level anomaly in the Pacific from August 1, 1996 to August 3, 1997.

More
El Niño: TOPEX/Poseidon altimeter sea level anomaly from August 1, 1996 to August 3, 1997

This visualization shows total sea level change between 1992 and 2019, based on data collected from the TOPEX/Poseidon, Jason-1, Jason-2, and Jason-3 satellites.

More
Video: 27-Year Sea Level Rise

Visualization of monthly changes in ocean bottom pressure data obtained by the GRACE satellites from November 2002 to January 2012.

More
Ocean bottom pressure from GRACE

Animation showing mass changes over Greenland with a colorbar, graph and clock overlay.

More
Greenland ice sheet mass changes from NASA GSFC GRACE mascon solutions with banded color scale

This animation compares sea surface salinity (saltiness) data from two NASA datasets from 2015 to 2017.

More
Animation: Sea Surface Salinity Comparison (2015-2017)
Animation: Sea Surface Salinity (Saltiness) Comparison (2015-2017)

Take a 360-degree view of an iceberg and sea ice during Operation IceBridge flights over Greenland.

More
iceberg flyover
Video: Bird's eye view of an iceberg

A quick guide to the science behind sea level rise from an ice-loss perspective, what it means in relatable terms and why it matters.

More
On thin ice: Why ice loss matters
Video: On thin ice: Why ice loss matters

1997 and 2015 El Niño animations made from data collected by the TOPEX/Poseidon (1997) and the OSTM/Jason-2 (2015) satellites

More
El Niño: 1997 vs. 2015

Join NASA Earth scientists for a 360-degree view of our planet as they head into the field to study ice in Greenland and coral reefs in Hawaii.

More
Earth 360 Video: The Call of Science

Whiteboard animation on NASA's twin GRACE satellites that monitor Earth's gravity field to help scientists understand global water and ice distribution.

More
NASA's Earth Minute: Scale in the sky
Video: NASA's Earth Minute - Scale in the sky

Video: Oceans Melting Greenland (OMG) Principal Investigator Josh Willis recaps an ambitious day out in the field.

More
Oceans Melting Greenland 9/22/16 update

Animation showing “sea level fingerprints,” or patterns of rising and falling sea levels across the globe in response to changes in Earth’s gravitational and rotational fields.

More
Monthly changes in gravity affect sea level

B-roll for media on the sea level-observing Sentinel-6 Michael Freilich satellite.

More
Sentinel-6 Michael Freilich Media Reel
Video: Sentinel-6 Michael Freilich Media Reel

Explore Kaneohe Bay with NASA’s CORAL scientists. During field campaigns, scientists take in-water (in situ) measurements to validate the data from airborne instruments.

More
video of divers
Video: Explore Kaneohe Bay with NASA's CORAL scientists

NASA's Oceans Melting Greenland (OMG) and Operation IceBridge missions investigate Greenland's thinning ice sheets from above and below.

More
Greenland's thinning ice

Map of sea surface height measurements collected by Jason-3 during its first 10 days of orbit.

More
Jason-3 begins mapping the ocean

Fly in 360 degrees over Greenland’s craggy glaciers and other ice formations from NASA’s P-3 aircraft.

More
glacier flyover
Video: Greenland's ice from above

Sea surface height-monitoring satellite Jason-3 liftoff from Vandenberg Air Force Base aboard a SpaceX Falcon 9 rocket.

More
Jason-3 liftoff on Falcon 9 rocket

Visualization showing total sea level change between 1992 and 2014, based on data from the TOPEX/Poseidon, Jason-1 and Jason-2 satellites.

More
22-year sea level rise - TOPEX/JASON

Data from TOPEX/Poseidon was used to produce a computer model of 16 days of tide height.

More
TOPEX/Poseidon flat earth tide height model
more resources

Newsletter

Stay Connected

News & Features

    • Sea Level News
    • Scientist Interviews
    • News Briefs

Understanding Sea Level

    • Overview
    • Global Sea Level
    • Regional Sea Level
    • By the Numbers
    • Vital Signs

Science Team

    • Overview
    • Team Members

Assessment Tools

    • Pacific Islands Flooding Analysis Tool
    • IPCC AR6 Sea Level Projection Tool
    • Flooding Analysis Tool
    • Interagency Sea Level Rise Scenario Tool
    • Sea Level Evaluation & Assessment Tool
    • All Assessment Tools

Analysis Tools

    • Data Analysis Tool
    • Virtual Earth System Laboratory
    • All Analysis Tools

Partners

    • Partners

Resources

    • Multimedia
    • Publications
    • Glossary
    • FAQ
    • Missions
  • Feedback
  • Privacy Policy
  • Accessibility

Site Manager: Carmen Blackwood
NASA Responsible Official: Doug Newman