News | May 11, 2017
Jump into a sea of new data from NASA's Oceans Melting Greenland
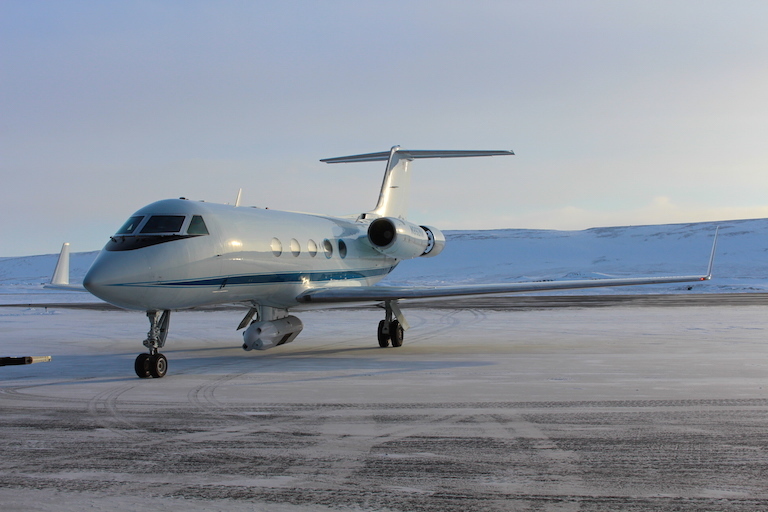
NASA's modified G-III aircraft, with the GLISTIN-A radar instrument visible below, on the runway at Thule Air Base, Greenland.
“Get to work,” Josh Willis, NASA’s Oceans Melting Greenland (OMG) principal investigator, said during a two-and-a-half-hour debriefing. “Get to work.” It was as though he’d been ringing one of those big ol’ dinner gongs.
Data! Hot off the press. Come and get your data! Calling all oceanographers, geologists, paleo-climate scientists: come and get a big ol’ helping of free data. Are you hungry for data yet?
OMG has just returned from its second spring season. Every April for five years, just before the ice starts to melt, OMG flies a radar instrument over almost every glacier in Greenland that reaches the ocean, and collects elevation measurements within a 6.2-mile (10-kilometer)-wide swath for each glacier individually, so we can see how quickly each one is thinning. That’s literally hundreds of glaciers.
“We have more than 70 of these swaths that cover a couple hundred glaciers to create new elevation maps that are high accuracy, high resolution, and high quality,” Willis said.
OMG also has bathymetry data from sonar and gravimetry, and a year’s worth of AXCTD data collected last September, plus hundreds of vertical profiles of temperature and salinity taken from ship surveys.
“We have temperature measurements in many glacial fjords that have never had an historical temperature profile before,” he said. “And none of that data is being used to its fullest extent yet.”
OMG will set the baseline so that we know what the water temperatures are today and as we look forward into the future, we can watch them warm. That’s huge.
Pause for a moment and think about how much of the ocean is still so unknown. Think about the OMG aircraft flying into remote, uncontrolled airspace, or researching the ocean water-ice interface around Greenland: So many of these places still nameless, still anonymous, still unidentified, still unknown. It’s mind blowing.
And somewhere in all this new data is information about the correlation between the ocean water and the ice as well as the answer to the question of how each glacier may or may not be affected by the waters offshore.
“We know that warm water reaches a lot of glaciers,” Willis said. “And there have been surveys in few places, but we’ve never had a comprehensive survey of the shelf water before.”
OMG is mapping out the edges of glaciers and watching them change year on year on year. The mission measures glacial elevation in the last few kilometers before the glacier hits the water to see exactly how much the glacier shrank or retreated or both. In a few cases the opposite might happen. Over a single year, a glacier might not have had as much calving or it might have slowed down, which would cause it to thicken and advance.
There are literally hundreds of glaciers to research and dozens of papers buried in that data. And anybody who wants to can sift through it and publish.
“You could get a Ph.D. done really fast,” Willis added enticingly. Here are some recommendations for interesting scientific research:
- OMG’s temperature data could be used to write oceanography papers about where the warm water is on the shelf. Cataloging which glaciers terminate in deep Atlantic water and which ones sit in shallow water needs to be mapped out. And OMG has enough data to catalog the depth of the faces of two thirds of the glaciers around Greenland.
- Paleo-climatologists and geologist can use new clearly mapped out OMG bathymetry data to study how ancient glaciers carved troughs in the sea floor to understand the implications for Greenland’s ancient ice sheet. Some flat-bottomed troughs show evidence of where little ancient rivers must have carved their way through to erode the paleo-glaciers. And sea floor sediments could be analyzed to find out how far the ancient glaciers advanced.
- Overview papers that compare and contrast the east, west, north and south coasts of Greenland would be incredibly useful to have.
- Some elevation maps made from historical datasets as well as a few decades’ worth of temperature measurements already exist for some isolated regions across Greenland. This makes it possible to look at the difference in temperature and elevation in these places to make a comparison with the current measurements and observe the changes.
- OMG is also gathering oceanography data around Greenland. Since the Atlantic Ocean water is very warm and salty and the Arctic Ocean water is cold and fresh, the ratio of those two could be analyzed. Warm Atlantic Ocean water has been in the coastal area around Greenland forever, but how much Atlantic water makes it onto the shelf and reaches the glaciers? This is affected by the bathymetry and the winds, which affect the local currents. And according to Willis, “There’s really still a lot to learn.”
Already there are four downloadable datasets. So, come and get it all you hungry Ph.D. oceanographers.
Get to work.
