News | May 2, 2018
GRACE-FO: Cracking a cold case
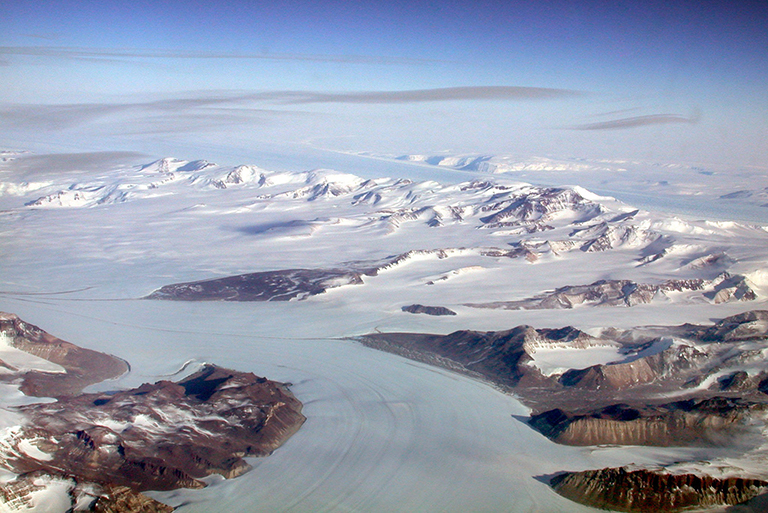
Meltwater from Antarctica glaciers like Darwin (foreground) and Byrd affects sea levels in the U.S. Credit: NSIDC/Ted Scambos
Reports of the rapidly melting West Antarctic ice sheet often refer to how much the melting could add to global sea levels -- as if meltwater raises the ocean evenly, like a sink filling up. The reality is far different. Water from West Antarctica will end up raising sea levels more in Los Angeles and Miami than in Rio de Janeiro, for example, even though Brazil is thousands of miles closer to Antarctica than the United States.
How do we know? Scientists first observed this ocean pattern using data from NASA's Gravity Recovery and Climate Experiment (GRACE) satellite mission, which ended last October after 15 years of operation. When the NASA/German Research Centre for Geosciences GRACE Follow-On (GRACE-FO) mission is launched from Vandenberg Air Force Base in Central California next month, it will take up the job of monitoring melting polar ice. That will give scientists a renewed opportunity to understand some of the many processes that lead to different rates of sea level rise on different coastlines. Since runoff from melting ice sheets and glaciers currently accounts for about two-thirds of global sea level rise, understanding these melt-related processes is a critical piece of understanding sea level change at a regional scale.
Fingerprints of water
The gravitational pull of an ice sheet attracts seawater from the nearby oceans and causes it to pile up along the coastlines. When the ice sheet melts and loses mass, the gravitational pull is reduced, causing the sea level nearby to fall. At the same time, the additional meltwater in the ocean causes sea level rise -- but it rises farther away from the melt source. The falling sea level near the ice sheet and rising sea level farther away are connected like the rising and falling ends of a seesaw. Since every ice sheet and glacier has a unique location and size, each one creates a different seesawing pattern, as individual as a fingerprint.
Scientists had theorized that these fingerprint patterns existed, but only observationally detected them for the first time in September 2017 using GRACE data.
The fingerprints from Greenland and Antarctica reach across the equator, so that low- and mid-latitude land masses are affected by melting from both regions. These coastlines may be affected more strongly by the ice loss in the opposite hemisphere. New York City, for example, experiences slightly more sea level rise from ice melt in Antarctica than from Greenland. Or for an extreme example, Greenland's ice loss is currently estimated to contribute 12 times as much to sea level rise in Cape Town, South Africa, than it is to rising seas in London, even though London is 8,000 miles closer to Greenland.
Imprints below Earth's surface
Another effect of the changing mass from melting ice involves not just recent ice loss but the continental-scale melt-off that ended about 6,000 years ago. That ancient event still has repercussions for sea levels on today's coastlines.
Frank Webb of NASA's Jet Propulsion Laboratory in Pasadena, California, the project scientist for GRACE-FO, used the analogy of memory foam to describe this effect. "When you lie on a memory foam bed, you sink into it. When you get up, it rebounds, slowly. There may be a slight bulge around where you were lying." In the same way, an ice sheet presses on Earth's viscous mantle layer, about 50 miles below the surface. Over millennia, the heavy ice pushes the surface layer down into the mantle, and mantle material bulges out elsewhere. When an ice sheet melts, the mantle flows back in the reverse direction, in a process that plays out for millennia after the ice has disappeared.
The North American tectonic plate is still rebounding from the loss of mass at the end of the last ice age. At that time, today's Canada and Greenland were buried beneath thick ice while most of what is now the United States remained ice free. The mantle flowed away from under Canada and bulged under the United States. Today, as the flow moves in the opposite direction, the U.S. side of the North American plate is sinking very slowly, and Canada is rising.
Even if there were no other changes occurring in today's oceans, these up-and-down movements of the solid Earth would cause sea levels to change on today's U.S. East Coast. As it is, they add to or counteract other influences on sea level.
The bottom line
Since the original GRACE mission launched in 2002, its measurements have shown that Greenland has been losing about 280 gigatons of ice per year on average, and Antarctic losses are at a rate of almost 120 gigatons per year. (One gigaton of water would fill about 400,000 Olympic-sized swimming pools.) The data also showed that the rate of loss accelerated from 2003 to 2013 by about 25 gigatons per year every year in Greenland, and 11 gigatons per year every year in Antarctica. While considerable uncertainties remain, the measurements from GRACE over the past 15 years leave scientists and planners concerned that sea level rise will be measured in feet rather than inches by the end of the century.
Combined, these other effects from gravitational changes as ice melts in Greenland and Antarctica can add or subtract 25 to 50 percent of a regional change in sea level caused by melting ice alone.
Questions remain about all of these processes. For example, how much natural variation is there in the rate of ice loss that we are currently observing? How does ice loss in some regions interact with natural climate patterns such as El Niño? While 15 years of high-quality, global and nearly uninterrupted data from GRACE have already produced a plethora of discoveries, the longer data record from GRACE-FO is essential to tease out the signal of long-term climate evolution from shorter-term effects of these recurring climate patterns.
GRACE-FO is scheduled to launch on May 19. For more information, see:
https://www.nasa.gov/missions/grace-fo
News media contact
Alan Buis
Jet Propulsion Laboratory, Pasadena, California
818-354-0474
Alan.Buis@jpl.nasa.gov
