News | May 31, 2016
A not-so-fond farewell to El Niño

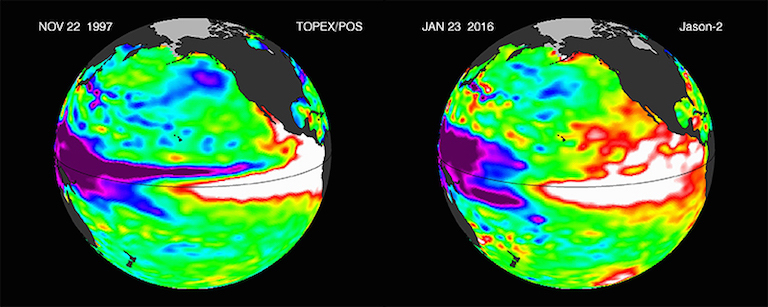
A record-breaking El Niño, now on the wane, was far larger than the last major El Niño in 1997-98, as shown in this side-by-side comparison of satellite images. The Topex-Poseidon and Jason-2 radar altimeter images show areas of increased sea-surface height in red and white, an indication of higher temperatures. Image credit: NASA-JPL
The tropical Pacific’s “Godzilla” El Niño was indeed a record breaker, and Bill Patzert has the images to prove it.
Patzert is an oceanographer at NASA’s Jet Propulsion Laboratory in Pasadena and the center’s El Niño point man. He predicted powerful effects from the mass of warmer-than-normal water that periodically appears in the tropical latitudes of the eastern Pacific.
The prediction was mostly on target. Strong El Niños can affect weather patterns around the world, and this one delivered the goods—and then some. Combined with global climate change, it made last year the hottest on record. Average global sea levels were driven about 7 millimeters higher as warming ocean water expanded. Severe drought came to Africa, South America, Southeast Asia and Australia, while Central America experienced heavy flooding.
“Globally, how warm was last year because of El Niño?” Patzert asked. “We’ve never had 12 consecutive months where the temperature set a record. And, of course, April was really hot, driven higher by El Niño. So it was definitely a scorching El Niño globally.”
Perhaps ironically, the only place where predictions failed was on Patzert’s home turf, Southern California. The last big El Niño, in 1997-98, brought a deluge and flooding to the region; this time around, rain bands were shifted to the north, providing average precipitation in Northern California’s Sierra Nevada mountains and some help to the state’s drought-strained water supply. But the hoped-for deluge never materialized.
“The disappointment was in California,” Patzert said. “We’re all still in a drought. Lake Mead just set a new record low; it’s never been this empty. So this El Niño not only dissed Southern California, it bypassed the Colorado River watershed.”
El Niño has begun to fade, though recent satellite images show a still-robust El Niño signal.
But as we bid the regional climate phenomenon farewell, a satellite data comparison provides some perspective. The earlier image (above) shows sea surface height measured by the radar altimeter aboard the Topex/Poseidon satellite; the recent image is from Jason-2’s radar altimeter. Increased ocean height near the eastern equatorial Pacific mostly reflects an increase in the amount of warm water in the upper 91 to 137 meters (300 to 450 feet) of the water column.
The images show the 1997-98 El Niño at its peak in late November 1997 as a large red and white area of higher-than-normal sea surface heights (warmer-than-normal sea surface temperatures) and, next to it, the peak of the latest El Niño this past January. These Niños covered a portion of the planet many times larger than the contiguous United States.
Talk about Godzilla.
“This latest Niño was longer lasting, larger and more intense than the previous monster El Niño,” Patzert said. “Check out these images; NASA’s satellite data tell the tale.”


