Your Gateway to NASA Earth Observation Data
The Earth Science Data Systems (ESDS) Program provides full and open access to NASA’s collection of Earth science data for understanding and protecting our home planet. Begin your Earthdata exploration by clicking on any of the discipline icons above.
Your Gateway to NASA Earth Observation Data
The Earth Science Data Systems (ESDS) Program provides full and open access to NASA’s
collection of Earth science data for understanding and protecting our home planet.
New to using NASA Earth science data? Our Data Pathfinders will help you chart a path through the process of selecting data products and learning how to use them. Click the arrows on either side of the box to find your topic-specific starting point.


Resource Spotlight
Find data, articles, webinars and other resources on relevant topics in one place on these spotlight pages.
Wildfires
NASA provides many resources for monitoring and tracking wildfires.
Open Science
Open Science empowers an inclusive, collaborative scientific process through the open sharing of data and knowledge.
Air Quality
Air pollution is one of the largest global environmental and health threats.
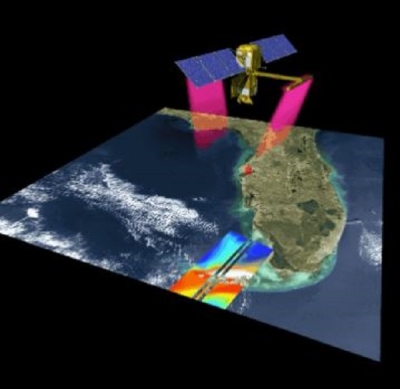
Recently released datasets from the SWOT mission provide scientists with previously unavailable measurements of Earth's surface water.
Article
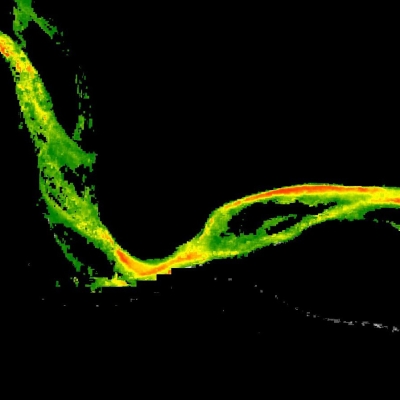
The NASA-funded Fresh Eyes On Ice project uses openly-available synthetic aperture radar (SAR) data to aid in predicting ice freeze, thaw, and coverage.
Article
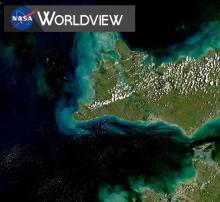
Worldview lets users browse more than 1,000 satellite imagery layers, create visualizations, and download the underlying datasets.

Data Chat
Aaron Friesz, a NASA Openscapes mentor at NASA's Land Processes Distributed Active Archive Center (LP DAAC), helps promote open science principles to empower more diverse, inclusive, and effective data science communities.
Article
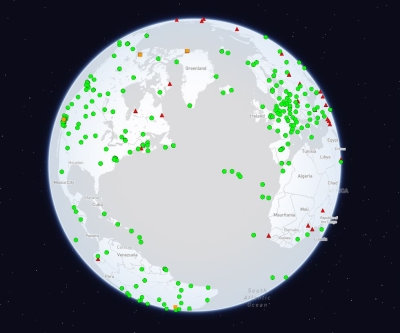
The International Global Navigation Satellite Systems Service (IGS), a voluntary federation of more than 200 self-funding entities, celebrates three decades of providing high-quality data.
Worldview Image of the Week
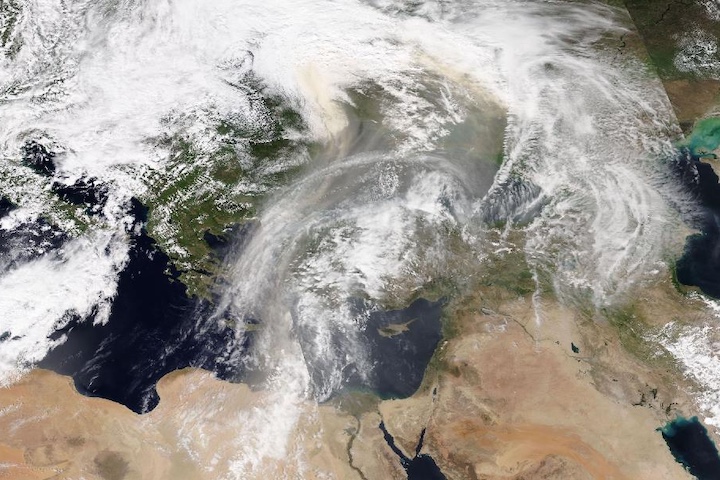
Image captured on Apr 24, 2024, by the VIIRS instrument aboard the joint NASA/NOAA NOAA-20 satellite.
Explore the ways you can engage with NASA Earth science data, services, and community.
