News | August 11, 2016
Greenland on the edge
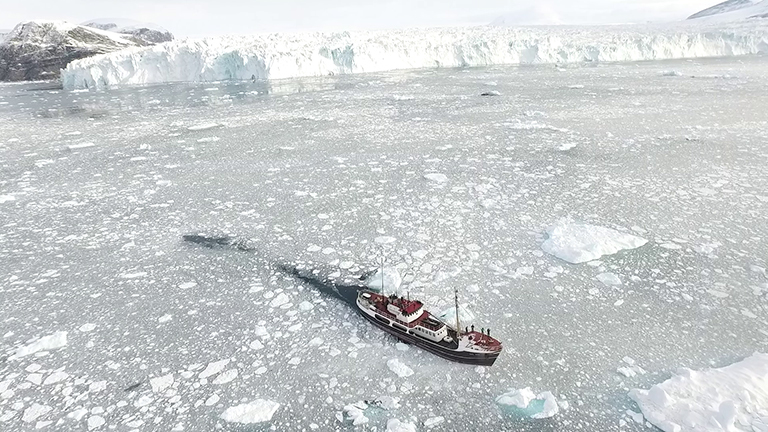
Greenland's northwestern coastline in September 2015 during Phase 2 of the TerraSond / Cape Race Bathymetry survey. Image credit: NASA/JPL.
A person can look at a thing over and over again before finally seeing it for the first time. That’s how I felt standing in front of an Arctic map at the University of Washington in Seattle. I gazed at the northwest coastline of Greenland, north of Baffin Bay, up where the Canadian Queen Elizabeth Islands come close to Greenland.
Of course I’ve looked at Arctic maps before, from a zillion different angles. Normally I’m the one pointing and explaining. But this time, standing next to James Morison, senior principal oceanographer from the University of Washington, I was the one listening, looking closely and being amazed.
We were in the hallway of the Applied Physics Laboratory’s polar science wing, taking a break between Oceans Melting Greenland (OMG) science team presentations. The walls were lined with photos of teams out on glaciers, ice drilling equipment, ice sheets of the world and grand ice-covered landscapes. Ice, ice and more ice, and penguins. There were pictures of polar bears and narwhals, too. But Greenland’s jagged coastline had me captivated. The islands, the convolutions, the fjords: phenomenal, mindboggling. I couldn’t take my mind off it.
OMG’s science team, led by principal investigator Josh Willis, has been interested in Greenland’s increased melt rate since NASA’s GRACE satellite observed two trillion tons of ice mass loss from the ice sheet in just a decade. According to Willis, “Greenland has enough ice to raise global sea levels by 20 feet.” So understanding how the ice sheets are going to evolve under a warming climate will be crucial to predicting the amount of sea level rise we’ll have to face.
A person can look at a thing over and over again before finally seeing it for the first time.
In addition to increased atmospheric global surface temperatures, which melt the ice sheet from above, warmer ocean water surrounding the island continent is also melting Greenland’s glaciers from around its edges. This melting is happening at the ice faces that sit below sea level up inside the fjords. And that melt velocity “will determine, to a large extent, what the future will hold as far as sea level rise from Greenland,” says Willis.
Because the seawater around 400 meters (1,312 feet) deep is 3 to 4 degrees Celsius (5 to 8 degrees Fahrenheit) warmer than the water floating near the sea surface, it’s the bathymetry around Greenland that controls where and how much of that warmer, saltier, subsurface Atlantic Ocean layer is able to reach far up into the fjords and increase ice loss at the glacier’s edge. OMG’s five-year expedition will measure the amount of warm Atlantic water sitting on the shelf and find out exactly how much ice is lost at all of the glacier faces each year. Willis believes this is the best way to figure out how much of Greenland’s ice loss is driven by rising ocean temperatures—and, ultimately, how much the ice-melt contributes to rising sea levels around the globe.
But this task is extraordinarily complicated. The edge of Greenland’s incredibly winding coastline is an unknown place where ice meets water meets seafloor. And the team will be exploring these vast areas in detail for the first time. Back in the meeting, as each of the dozen or so OMG members took his or her turn updating the team on their most recent topography, temperature and salinity measurements, I noticed a trend. Everyone kept repeating the phrases: “never been surveyed before,” and, “it’s a very tough area” and, “ these fjords are so very small, they have no names, they’ve never been visited before.”

My mind drifted off to the edge of that unimaginably complicated coastline, where the ice is melting as fast as we can measure. And I had to stop the group to ask why. Specifically, why is it so tough? Why has no one been there before? It turns out this area is difficult to navigate because big chunks of remnant sea ice and icebergs bigger than the ship clog up the water. The crew has to snake in between floating icebergs and weave in and out of the narrow fjords. It’s rather treacherous. And weather conditions can be challenging up there. The other reason this area is so unknown is that the glacier has retreated so recently that the coastline is changing as fast or even faster than we can study it.
Last summer, a small group that included UC Irvine graduate student Michael Wood sailed on the M/V Cape Race deep into some of the most jagged areas around southeastern Greenland, which, according to Co-Investigator Eric Rignot, is the “most complex glacier setting in Greenland.” The ship used multi-beam sonar to measure seafloor bathymetry very close to the coastline. After more than 7,871 kilometers (4,250 nautical miles) of sea-floor depth measurements and more than 300 Conductivity, Temperature Depth (CTD) casts, the first bathymetric survey was completed. Currently, a smaller vessel equipped with single beam sonar is going up into smaller places, driving up the fjords and getting as close to the glaciers as is safe. And another ship, the M/V Neptune will survey the sea floor along the southeast Greenland coastline.
The coastline is changing as fast or even faster than we can study it.
OMG also surveyed the Greenland coastline with airborne gravity instruments in key regions to help fill in the gaps in the sea-floor measurements collected by the ship, and surveyed glacier elevation near the end of marine-terminating glaciers using NASA’s airborne synthetic aperture radar altimeter GLacier and Ice Surface Topography INterferometer (GLISTIN-A).
After a successful first year, OMG is headed up to Greenland again this fall to deploy 250 Aircraft eXpendable Conductivity Temperature Depth (AXCTD) probes that will measure temperature and salinity of the waters around Greenland from one of NASA’s G-III aircraft.
And over the next five years, the field campaign will collect repeat measurements of glacier elevation as well as temperature and salinity data around the edges of the continent in the hopes of learning more about just how quickly the ice sheet is melting.
