News | November 4, 2021
Track Sea-level Changes Anywhere with NASA's New SEA Tool
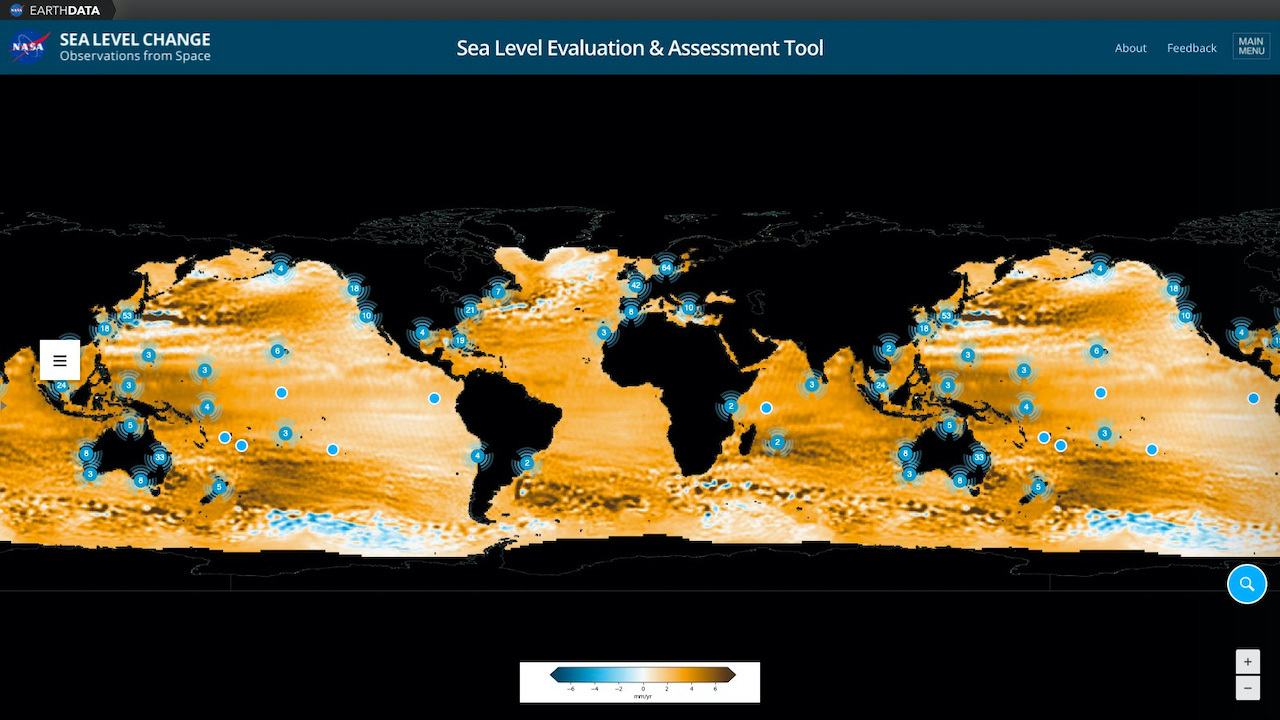
With a click, NASA's new online SEA tool provides a snapshot of sea-level change for locations around the planet. Credit: NASA/JPL-Caltech
Click anyplace on a map of Earth’s ocean, and you can get an instant reading of sea-level change – whether close to home or far away.
Click on coastlines around the world, and you’ll receive a detailed report on the major contributors to changing sea level at each location.
NASA’s newly updated online tool, SEA (Sea-level Evaluation and Assessment), provides a snapshot of the ocean’s rise or fall for locations across the planet. It covers the period between 1993 and 2019.
In most places, you’ll find sea levels rising; globally averaged sea level has increased significantly over decades. But quirks of ocean currents, rising or falling coastlines, and even gravity itself mean sea-level change is not uniform across the planet.
Get NASA's Sea Level Change News: Subscribe to the Newsletter »
Check the SEA tool and you’ll find, for instance, a slight drop in sea level off the Aleutian Islands, and larger drops off the coast of Antarctica.
The SEA tool combines data from satellite measurements, tide gauges, and other land and sea-based observations and products. You can check “total” sea-level change for points around the globe, or just the contribution from ice-melt and the water cycle, from ocean variation from region to region, or from ground movement.
The reports for coastal locations highlight the importance of “relative” sea level change – how much sea level rises or falls relative to coastal lands that can also move up and down. This coastal relative sea-level change is of greatest significance to planners and the public. Understanding the physics behind sea level changes is the first step toward producing meaningful projections of its future changes, which are critical for decisions about development and infrastructure.
The first version of the SEA tool included only U.S. coastal regions; with the upgrade, the tool goes global. The tide-gauge locations now match those in the popular sea-level projection tool, a combined effort by NASA and the Intergovernmental Panel on Climate Change (IPCC), allowing users to project future sea-level changes around the world.
“As the world leaders gather to begin climate discussions this week at COP26, NASA delivers trusted information that can help making a choice towards a more habitable future or prepare for a new climate reality,” said Dr. Nadya Vinogradova Shiffer, program scientist and manager at NASA Headquarters in Washington.
Both tools are hosted on NASA’s Sea Level Portal as well on the NASA Earth Science Climate Tools page.
SEA was created by NASA’s Sea Level Change Team to provide useful data to coastal planners and other decision-makers, and to help broaden public understanding of sea-level change. And it’s a first step toward one of the team’s core science objectives: using observations from satellites and from the surface, as well as computer models and other analytical techniques, to better understand sea-level change past, present, and future.
